

Wind Trends as of 27-Apr-2024 at 1:25am
( Note: Only the 'Current' values may be updated in near-realtime, while the other values are current when the page is loaded. The other data was from 27-Apr-2024 1:25am. Reload this page for updated data.)
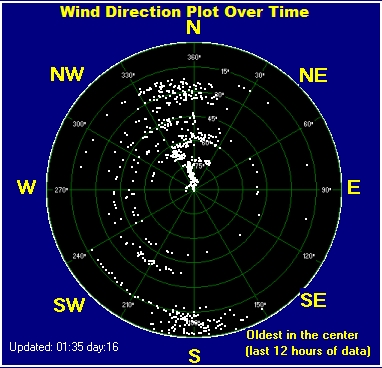
Latest Wind Data
| CURRENT |
|
|
| Now | 3.1 mph ESE | |
| Gust | 3.0 mph ESE | |
| Gust/hr | 7.0 mph | |
| WIND GUST HIGHS | ||
| Today | 7.0 mph ESE at 12:05am | |
| Yest. | 22.0 mph at 3:52pm | |
| Month | 32.0 mph on 17-Apr-2024 | |
| Year | 50.9 mph on 15-Jan-2024 | |
| WIND GUST AVERAGE HIGHS | ||
| Today | 3.9 mph ENE at 1:10am | |
| Yest. | 13.7 mph at 3:53pm | |
| Month | 14.4 mph on 02-Apr-2024 | |
| Year | 21.6 mph on 13-Jan-2024 | |
| WIND RUN | ||
| Today | 2.93 miles | |
| Month | 2096.30 miles | |
| Year | 7762.46 miles | |
Wind run is a measurement of how much wind has passed a given point during a given period of time. A wind blowing at five miles per hour for an entire day (24 hours) would give a wind run of 120 miles for the day.
Wind Trend Graphs
Graphs generated by Virtual Weather Station (V15.00)


